Analysis of Free-Tier, Cloud Compute Platforms - Introduction
Introduction
I didn't start out with the idea of analyzing different cloud services, but then that's what happens when tinkering becomes interesting.
Since its release in 1997, I've been a fan of the movie Contact. It was my first introduction to SETI and radio telescopes. Around the same time, computing started to become a thing. When I heard about distributed.net and the SETI@Home project, I immediately latched on....because I'm a nerd.
Initially, SETI@Home was released as a stand-alone client. More recently, it was rebuilt as a project under the BOINC program at the University of California Berkeley. As part of this program, you can donate CPU cycles to any number of (non-cryptocurrency) projects. The Clean Energy Project, The SkyNet, and Einstein@Home are all other projects available the BOINC program.
To participate, the BOINC client is installed on the target system and registered. Based on the user's preferences, data blocks one or more of several projects will be downloaded, analyzed and results returned to the project. The analysis is a very CPU intensive operation. By distributing the load among thousands of volunteers, the project can avoid costly investments in supercomputing hardware.
What does this have to do with Cloud Computing? With the proliferation of cloud platforms, such as Amazon Web Services, Google Cloud Platform, Microsoft Azure, I thought it would be interesting to see how these services handle CPU intensive workloads with SETI@home being the use case.
Baseline
My rebuilt MacMini was released in approximately 2008. It has an Intel Core2 T7200 processor with 2 cores running at 2.00gHz, 1GB of RAM and a small hard drive. As part of my functional rebuild, I installed Debian Linux 10(buster) and connected to my home's wifi network, but without any peripherals.

The SETI@home client does some basic benchmarks on the CPUs. For the purpose of this evaluation, we'll look at Measured Integer Operations/second and Measured Floating Point Operations/second. From what I can tell, these measures occur the first time the client starts and remain static otherwise.

In addition to these metrics, there is also the Recent Average Credit (or RAC) as calculated by the BOINC client. RAC is an independent measurement of daily work performed by a system. RAC is a preferred unit of measure due to the potentially irregular amount of CPU time necessary to analyze the block.
Since September 9, 2019, the Recent Average Credit for my MacMini has been in the mid 500s. The Screenshot below was taken on September 16, 2019.
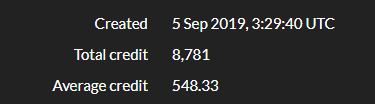
Is that good? Is it bad? Wait for Part II.
Also, if tabular data is more your thing, the metrics are available in spreadsheet form.
Also, if tabular data is more your thing, the metrics are available in spreadsheet form.

Comments
Post a Comment